This post is about an issue I faced with one of our customers who have their Microservices running on Windows Server and IIS. The servers were load-balanced by an AWS NLB but were experiencing timeouts randomly.
Architecture
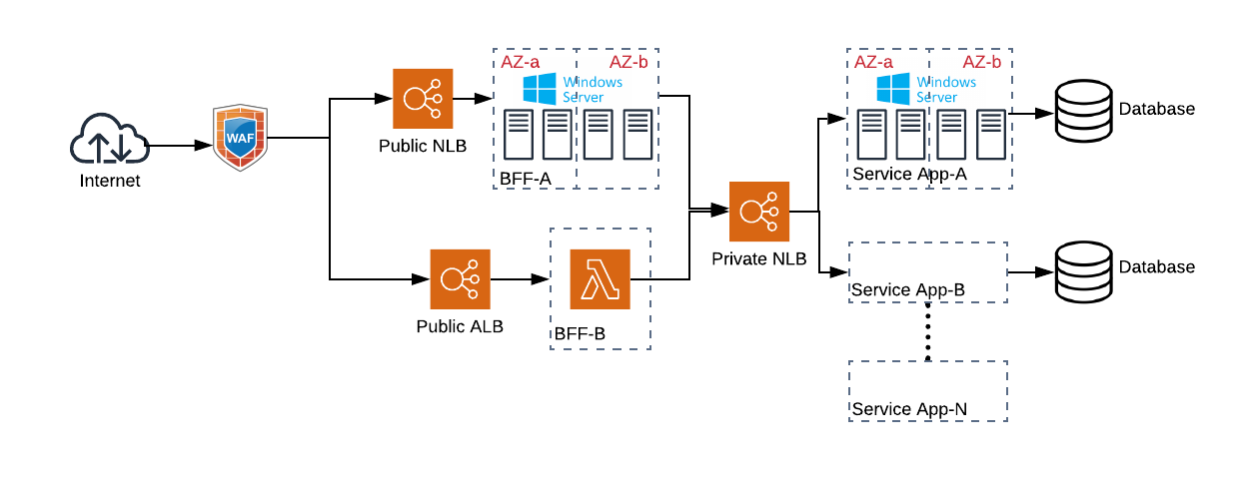
At a high-level the architecture reflects the following pattern
-
A public facing Network Load Balancer (NLB) sits behind a Web Application Firewall (WAF) and routes traffic to a group of IIS Web servers running Windows Server. The applications running on IIS are Backends-for-Frontends (BFFs).
-
The BFFs consume Microservice APIs exposed via an internal NLB which are
ASP.NET Web APIs using .NET Framework.
Problem and Investigation
The problem we were facing was random API timeouts when the BFFs consume a specific service, Service-A. Things were made worse when a GraphQL BFF was consuming multiple API endpoints to provide a single response back to its frontend: when one of the requests to the service layer times out, the whole frontend response failed.
The first point of investigation was, is our application doing something wrong?
Issue Replication
Since this was happening randomly we wanted a more reliable way of replicating the issue and using the frontend until it hits a timeout was not an option. So we created a Lambda function which has the exact same network configuration as our BFF but does only one thing: call Service-A. All service APIs expose diagnostics endpoints. So this Lambda function makes a call to the diagnostic endpoint and passes a timestamp as a correlation ID so that we can trace it from Lambda logs as well as application logs.
import logging
import time
import urllib;

def lambda_handler(event, context):
    handler = urllib.request.HTTPHandler(debuglevel=10)
    opener = urllib.request.build_opener(handler)
    ts = time.time();
    req = urllib.request.Request("https://<apiUrl>:8080/diagnostics/health?ts=%s" % (ts))

    try:
        response = opener.open(req)
        body = response.read().decode('utf-8')
        logging.info("ts=%s Message received %s", ts, body)
    except urllib.error.HTTPError as e:
        logging.error("ts=%s Request failed: %d %s", ts, e.code, e.reason)
        raise e
    except urllib.error.URLError as e:
        logging.error("ts=%s Server connection failed: %s", ts, e.reason)
        raise e

return {
        'statusCode': 200,
        'body': 'OK'
       }
To replicate the issue, above Lambda function was invoked number of times until it threw an exception. This was done with the following Powershell commands using AWS CLI
for ($i=0; $i -le 100; $i++) {
    aws lambda invoke --function-name Lambda-ServiceA-Test --invocation-type RequestResponse --payload '{}' out.log
    sleep 2
}
When the API request failed, Lambda logs showed something like this
[ERROR] 2019-06-11T01:13:21.678Z 6fa1fe72-22bd-4349-81b8-a8a3bebc71e1 ts=1560215581.6566658 Server connection failed: timed out
To trace if the request actually reached our application, we checked IIS logs.
IIS request logs are usually stored under C:\inetpub\logs\LogFiles\ and grouped in directories based on the ID of the Application Pool. This ID can be found by
Import-Module WebAdministration; (Get-ItemProperty IIS:\Sites\<applicationPoolName>).id
where <applicationPoolName> is the name of the Application Pool.
Nothing was found in IIS logs for failed Lambda requests. The correlation ID ts=<timestamp> came in to use here. When the requests were received by IIS, log lines like the following is seen
2019-06-11 00:56:37 172.17.33.234 GET /diagnostics/health ts=1560214587.5400608 8080 - 172.17.46.107 Python-urllib/3.6 - 200 0 0 4
NLB stats
Requests not being received by the target servers led us to think there could be something wrong with the NLBs. NLBs operate at TCP layer and provide only TCP level metrics. They do not provide any metric on HTTP status codes returned by targets, unlike AWS Application Load Balancers (ALB). One common scenario of NLB timeout is if the client (connecting to NLB) and target (receiving traffic from NLB) are the same instance and the targets are registered with NLB as type instance. This can be avoided by registering instances by IP address (AWS documentation explains why this happens).
Since NLBs provide only TCP level metrics, the metrics that are useful for troubleshooting connection issues are client and target reset count (TCP_Client_Reset_Count and TCP_Target_Reset_Count). These are the counts of TCP RST messages (TCP packets with RST flag set) originated from client and target. A TCP RST indicates an abrupt or forceful termination of a TCP connection and is usually sent when an unexpected TCP packet arrives at a host.
Looking at the different NLBs in the system, we noticed that the target TCP RST count is unusually high across all of them, in particular the NLB that the timeouts occur with (blue dots in the figure below) had the highest number.
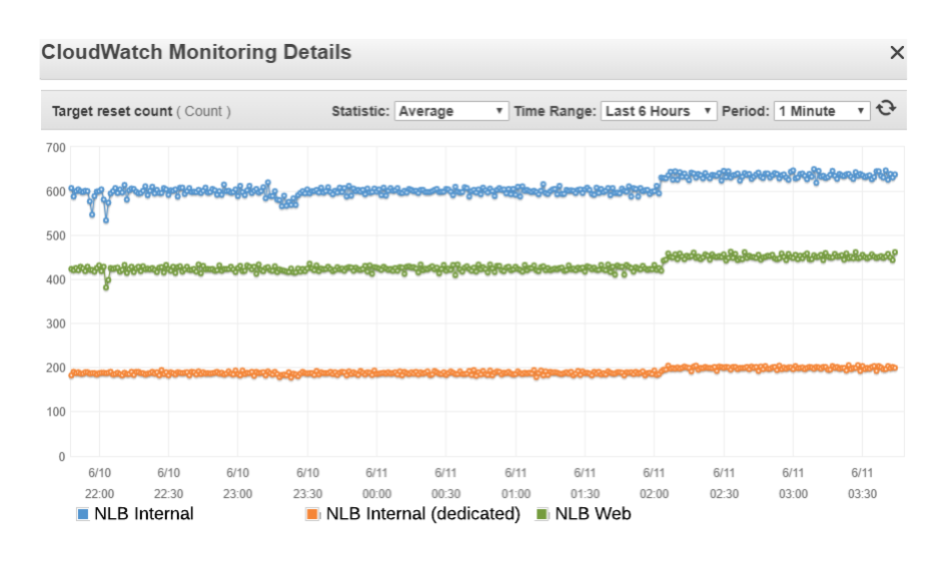
TCP RSTs of different NLBs
That NLB is shared with multiple targets, so to eliminate any possible issue with the NLB itself, we created a new dedicated NLB and added the same target servers. The count of TCP RSTs went down but still wasn’t zero. We were scratching our heads at this point as NLBs are usually quite stable and there are almost no issues reported in AWS forums related to NLBs. We reached out to AWS support for assistance but apart from pointing us the abnormality with TCP RSTs they weren’t able to help us because managing host configuration is our responsibility due to the AWS shared responsibility model.
This led us to believe it could be something wrong with either the EC2 instances or the Windows Operating itself. There were few similar issues reported on the internet (e.g. this one) although they weren’t applicable to our case.
So we went on to investigate what was going under the hood with TCP connections in our application servers.
Packet capture
Windows equivalent of Wireshark is Microsoft Message Analyzer (MMA). But we didn’t want to install new tools on our application servers. So instead we used the built-in netsh command which is the Windows equivalent of the popular tcpdump tool.
We followed the following steps to capture network traffic
- Start a capture by running
netsh trace start scenario=NetConnection,LAN,InternetServer capture=yes report=yes persistent=no maxsize=1024 correlation=yes traceFile=C:\logs\trace.etl
This creates a trace file C:\logs\trace.etl until it reaches 1GB in size (maxsize=1024).
-
Replicate the issue by invoking the test Lambda function
-
Stop the capture by running
netsh trace stop
The .etl file can be converted to a .pcap using MMA because Wireshark can only open .pcap files.
It showed something like the following

Target Packet Capture
Basically, there were so many connections being opened by the NLB and were getting terminated by the host. Zooming in to a specific stream:

Resolution
At this point it was pretty clear that there was something wrong with the host instances. Since we use Silver AMIs (customised AWS Golden AMIs) we were not sure it was due to some configuration that we did. So we set up target instances for the NLB using (i) a stock AWS Windows 2016 AMI running the default IIS Website and (ii) an Ubuntu AMI running a simple python web server (this can be done without any extra tools by running # python3 -m http.server as python3 is shipped with Ubuntu).
What we noticed with NLB TCP RSTs was quite interesting:

TCP RSTs with different targets
Even with the stock Windows AMI, TCP RSTs were still happening. They decreased when NLB cross-zone load balancing was disabled (point a.) but almost doubled with cross-zone load balancing (point b.). And surprisingly, there were no TCP RSTs with Ubuntu server (point c.).
Also interesting was this behaviour happening even when no traffic was being injected. This meant two things:
-
NLB was sending too many (relatively) TCP connection requests without any other traffic to the targets
-
There was (probably) something different of how Windows handles and responds to those TCP connection requests
The many connections must be the NLB health checks. These cannot be disabled in NLBs. What we realised then is (and what we didn’t pay enough attention to initially) was that the NLB health check is of type TCP. TCP health checks shouldn’t have any problem as it works absolutely fine as we noticed with the Ubuntu host and there’s no documented misbehaviour. Besides, it is the default health check type. Thinking why not, we changed health check type to HTTP and it did the trick!

TCP RSTs with HTTP health check
The TCP RSTs from the Windows host went to zero.
Lessons learnt
This was an annoying issue yet the investigation was quite interesting. The key finding was that you shouldn’t be using TCP health checks for Windows hosts (at least for the specific EC2/Windows Server configuration that we used).